Large portions of this are based on the old Github Wiki, much of which may now be out of date.
⚠️ If you want to try out the commands/tasks described in this document (or any other) please use the staging server for that, not the production one. You can easily distinguish between these two by looking at the command line prompt (
~ @staging>vs~ @production>).
SSH to production
This process will work for any of our instances running on EC2 servers.
- Go to running instances and select the prod one
- Click on “Connect” in top-right of the screen
- Click “Connect” under the “Session Manager” tab (this is the tab which loads by default)
Troubleshooting Production
The website is mostly Rails and Javascript, with a layer of nginx in front of them. There’s nothing special about our nginx setup, so the internet is your friend if it looks like there’s an nginx problem. It’s very rare that anyone goes wrong with nginx though.
Rails pages are newer bootstrappy looking pages that have a navbar with sign in and sign out functionality.
Debugging Rails
We run our Rails code on Puma. Rails logs are at /home/cubing/worldcubeassociation.org/WcaOnRails/log/production.log.
New Relic can also be a useful tool for getting some insight into Rails - particularly for searching logs.
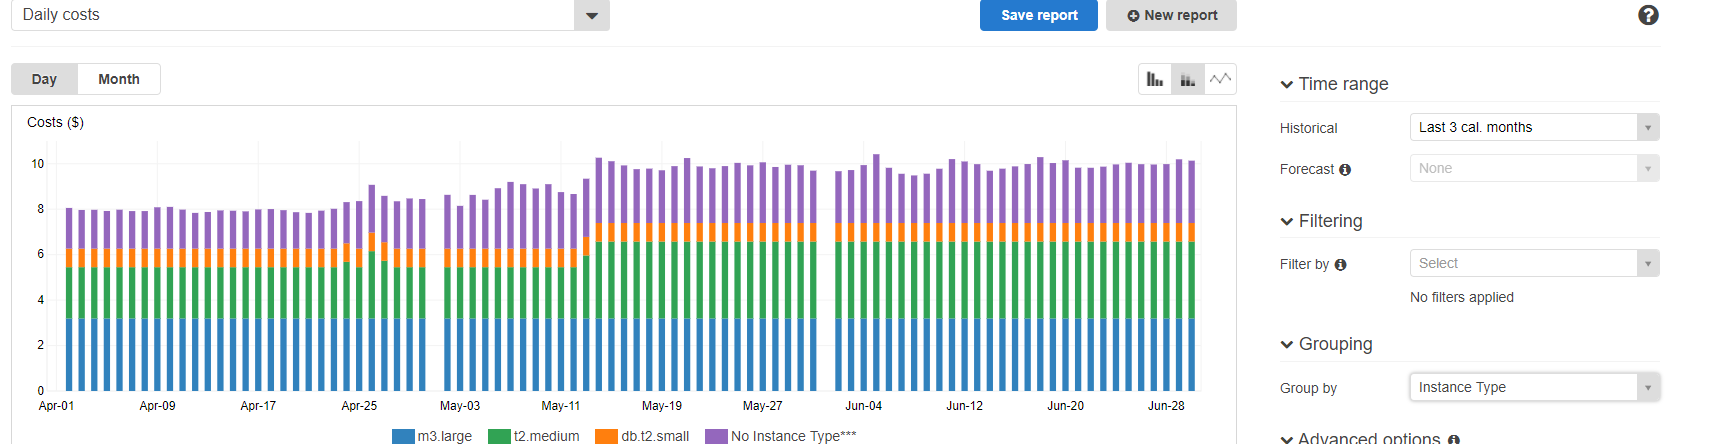
Generating cost reports
Go to https://console.aws.amazon.com/billing/home?region=us-west-2#/costexplorer and click Launch Cost Explorer.
On the advanced options > include costs related to uncheck “Credits”.
The rest behaves as you would expect
some example decent configs are
- under time range put in some forecast

- grouping costs by instance type
Useful Commands to Know
How to run migrations on production or staging after deploying the latest code:
~/worldcubeassociation.org/WcaOnRails @production> RAILS_ENV=production bin/rake db:migrate
General information
Secrets
WST recently transferred secrets management to Vault - this section needs to be updated.
- Production secrets are stored in an encrypted chef data bag at
chef/data_bags/secrets/production.json.- Show secrets:
knife data bag show secrets production -c /etc/chef/solo.rb --secret-file secrets/my_secret_key - Edit secrets:
knife data bag edit secrets production -c /etc/chef/solo.rb --secret-file secrets/my_secret_key
- Show secrets:
Note: in order to do this locally, you need to fetch the secrets/my_secret_key key from production, as well as fetch and edit the chef configuration file /etc/chef/solo.rb from production.
Vagrant
This section may well be years out of date - review by senior members needed.
The following sections assumes you are familiar with basic unix shell operations.
Accessing the VM
When you put the VM up using vagrant up noregs, it will start the Rails application in a screen session, making the website available on http://localhost:2331.
You can ssh to the VM using vagrant ssh noregs.
Accessing the screen session
Once you ssh-ed to the VM, you can resume the screen session using : screen -r
From there you can use ^a " (Ctrl-A + “) to list the windows in the session. The shell running the Rails application is the one named “run”.
Updating the database
If the last changes you fetched change the db schema, you will have to migrate the application.
For this you have to go to the application’s root directory (“WcaOnRails”) of the git repository. It’s a shared folder between the host and the VM, and it’s mounted on /vagrant/WcaOnRails inside the VM. (You can also just switch to the “dev” window in the screen session, which is shell in this directory)
From there you see what migrations are pending using :
RACK_ENV=development DATABASE_URL=mysql2://root:pentagon-pouncing-flared-trusted@localhost/cubing bundle exec rake db:migrate:status
And apply them using :
RACK_ENV=development DATABASE_URL=mysql2://root:pentagon-pouncing-flared-trusted@localhost/cubing bundle exec rake db:migrate
Restarting the application
This is necessary if you changed the configuration files. You can just stop the running application in the shell and go back in the history to get the command, for the record here it is :
RACK_ENV=development DATABASE_URL=mysql2://root:pentagon-pouncing-flared-trusted@localhost/cubing bundle exec rails server
Running tests and filling the database
Wonder if you changes will pass the travis build ?
Go to the application directory and set up a test database:
RACK_ENV=test DATABASE_URL=mysql2://root:pentagon-pouncing-flared-trusted@localhost/cubing_test bundle exec rake db:reset
Then go to the application directory and run the testsuite yourself using :
RACK_ENV=test DATABASE_URL=mysql2://root:pentagon-pouncing-flared-trusted@localhost/cubing_test bundle exec rspec
Looking up routes
If you modified the application routes, you probably want to check the existing routes and check that you didn’t break anything. From the application directory you can display the current routes using :
bundle exec rake routes
Debugging
An easy way to inspect the application state is to use byebug. You can basically put “byebug” somewhere in the code (preferably where you think it breaks :wink: ), and the application will stop on this point and open a byebug prompt in the application shell. If you already know gdb the features and usage are similar, please take a look at the guide for a detailed overview.
Clearing Cache
The server uses filestore for caching and we’ll need to periodically clear the cache.
Running df -h will show 100% usage on /. When this happens, we’ll need to run the Rake command: RACK_ENV=production bin/rake tmp:cache:clear
Operating the Website
Here you can find the most common operations necessary to keep the website running.
Checking the state of the app
This is highly out of date, and requires a rewrite.
The website is essentially a system process responsible for handling incoming requests. To see if the process(es) are running you can run the following command (list all processes then filter the relevant ones):
~ @staging> ps aux | grep unicorn
cubing    9115  0.0  4.2 531308 170704 ?       Sl   Dec06   0:07 unicorn master -D -c config/unicorn.rb
cubing    9161  0.0  4.5 599932 182536 ?       Sl   Dec06   0:24 unicorn worker[1] -D -c config/unicorn.rb
cubing    9165  0.0  4.5 599932 182368 ?       Sl   Dec06   0:24 unicorn worker[2] -D -c config/unicorn.rb
cubing    9169  0.0  6.6 666520 268332 ?       Sl   Dec06   0:24 unicorn worker[3] -D -c config/unicorn.rb
cubing   24181  0.0  4.2 599932 172732 ?       Sl   15:07   0:00 unicorn worker[0] -D -c config/unicorn.rb
cubing   24607  0.0  0.0  10472   900 pts/4    S+   15:18   0:00 grep unicorn
The second column is the process identifier (useful when you want to manage the process, e.g. terminate it), whereas the last column is the actual command behind the process.
As you can see there are several processes, four workers and one master process supervising them (so if any of them goes down, a new process is started).
To terminate the app you can use the kill command providing the process identifies (PID) of the master process. In this case:
~ @staging> kill 9115
Now you can verify that the processes are no longer there:
~ @staging> ps aux | grep unicorn
cubing   24633  0.0  0.0  10472   900 pts/4    S+   15:19   0:00 grep unicorn
Usually that’s what you see when the website is down.
(Re)starting the website
❗ That’s the most common way of fixing “the website is down” issues.
To start the app (or restart if already running) you can run the deploy script like so:
~ @staging> worldcubeassociation.org/scripts/deploy.sh restart_app
Once this finishes you can verify it’s up again:
~ @staging> ps aux | grep unicorn
cubing   24838 30.6  4.2 530784 170600 ?       Sl   15:30   0:06 unicorn master -D -c config/unicorn.rb
cubing   24848  0.0  4.0 530784 164816 ?       Sl   15:30   0:00 unicorn worker[0] -D -c config/unicorn.rb
cubing   24852  0.0  4.0 530784 164788 ?       Sl   15:30   0:00 unicorn worker[1] -D -c config/unicorn.rb
cubing   24856  0.0  4.0 530784 164888 ?       Sl   15:30   0:00 unicorn worker[2] -D -c config/unicorn.rb
cubing   24860  0.0  4.0 530784 164812 ?       Sl   15:30   0:00 unicorn worker[3] -D -c config/unicorn.rb
cubing   24869  0.0  0.0  10472   900 pts/4    S+   15:31   0:00 grep unicorn
Talking to the database
We have PhpMyAdmin available now - document how to use this instead.
You can connect to the MySQL database shell simply by running:
~ @staging> mysql cubing
Now you should see a new CLI prompt and be able to run SQL queries:
mysql> SELECT COUNT(*) FROM Competitions;
+----------+
| COUNT(*) |
+----------+
|     7202 |
+----------+
1 row in set (0.04 sec)
⚠️ Feel free to play around with the database on the staging server, however on the production server please use it only when necessary. Even running some SELECT queries may hurt the application performance if those queries are more complex.
Looking at currently running queries
If the website feels overly slow as a whole, it may be cased by some expensive queries taking a long time to execute. You can see the currently running queries like so:
mysql> show processlist;
+-------+-----------------+---------------------+--------+---------+---------+------------------------+----------------------------------------------------------------+
| Id    | User            | Host                | db     | Command | Time    | State                  | Info                                                           |
+-------+-----------------+---------------------+--------+---------+---------+------------------------+----------------------------------------------------------------+
|     4 | event_scheduler | localhost           | NULL   | Daemon  | 2892897 | Waiting on empty queue | NULL                                                           |
|  7423 | rdsadmin        | localhost:9799      | NULL   | Sleep   |      15 |                        | NULL                                                           |
| 30384 | root            | 172.31.26.116:57371 | cubing | Sleep   |       1 |                        | NULL                                                           |
| 30385 | root            | 172.31.26.116:57373 | cubing | Sleep   |       4 |                        | NULL                                                           |
| 30389 | root            | 172.31.26.116:57386 | cubing | Sleep   |      16 |                        | NULL                                                           |
| 30390 | root            | 172.31.26.116:57388 | cubing | Sleep   |      45 |                        | NULL                                                           |
| 31174 | root            | 172.31.26.116:57968 | cubing | Sleep   |      66 |                        | NULL                                                           |
| 31176 | root            | 172.31.26.116:57972 | cubing | Query   |       0 | starting               | show processlist                                               |
| 31177 | root            | 172.31.26.116:57973 | cubing | Sleep   |     248 |                        | NULL                                                           |
| 31179 | root            | 172.31.26.116:57974 | cubing | Sleep   |       6 |                        | NULL                                                           |
| 31182 | root            | 172.31.26.116:57976 | cubing | Query   |     111 | executing              | SELECT BENCHMARK(1000000000, MD5('example complex operation')) |
+-------+-----------------+---------------------+--------+---------+---------+------------------------+----------------------------------------------------------------+
11 rows in set (0.01 sec)
The time is shown in seconds. Above you can see an example of a query in the executing state that is taking 111 s already. You can see the actual query in the last column to verify if it looks suspicious.
A long-taking query usually implies some performance issues (e.g. a heavily accessed page that runs a complex query with no proper indexing), so it’s best to investigate where the query came from and how can the performance be improved. If the database struggles because of many complex queries, then you may help it by killing some of them using their identifier:
mysql> kill 31182;
Query OK, 0 rows affected (0.00 sec)
Now you can see the query is gone:
mysql> show processlist;
+-------+-----------------+---------------------+--------+---------+---------+------------------------+------------------+
| Id    | User            | Host                | db     | Command | Time    | State                  | Info             |
+-------+-----------------+---------------------+--------+---------+---------+------------------------+------------------+
|     4 | event_scheduler | localhost           | NULL   | Daemon  | 2892925 | Waiting on empty queue | NULL             |
|  7423 | rdsadmin        | localhost:9799      | NULL   | Sleep   |      13 |                        | NULL             |
| 30384 | root            | 172.31.26.116:57371 | cubing | Sleep   |       4 |                        | NULL             |
| 30385 | root            | 172.31.26.116:57373 | cubing | Sleep   |       2 |                        | NULL             |
| 30389 | root            | 172.31.26.116:57386 | cubing | Sleep   |      44 |                        | NULL             |
| 30390 | root            | 172.31.26.116:57388 | cubing | Sleep   |      13 |                        | NULL             |
| 31174 | root            | 172.31.26.116:57968 | cubing | Sleep   |      94 |                        | NULL             |
| 31176 | root            | 172.31.26.116:57972 | cubing | Query   |       0 | starting               | show processlist |
| 31177 | root            | 172.31.26.116:57973 | cubing | Sleep   |     276 |                        | NULL             |
| 31179 | root            | 172.31.26.116:57974 | cubing | Sleep   |      34 |                        | NULL             |
+-------+-----------------+---------------------+--------+---------+---------+------------------------+------------------+
10 rows in set (0.00 sec)
Looking into the logs
This can be done via NewRelic now.
There are several log files you may look into:
worldcubeassociation.org/WcaOnRails/log/production.log- that’s a very detailed log of the Rails application, it includes SQL queries and details about requests that errored/var/log/nginx/access.log- this file includes one line per every incoming request, so it’s sometimes useful for monitoring the current traffic
Changing our Google API KEY
You should go to the developer console (login with the wca.software google account which is in our credentials document), select the “WCA production key”, and add the new server’s IP (you should also remove the old server’s IP).
Staging
We have another server with production-like setup, but used only for testing. You can establish through by connecting to the staging instance listed in our EC2 instances.
Updating the Staging Database
This is done using a similar process to getting the developer database for local development.
- Connect to the staging server
- Make sure you’re the
cubinguser:sudo su cubing - Switch to the WcaOnRails folder:
cd worldcubeassociation/WcaOnRails - Load the developer database:
RAILS_ENV=production bin/rake db:load:development- NOTE: This takes a very long time (~60 minutes) to execute.
- Run a database migration:
RAILS_ENV=production bin/rake db:migrate